Garbage Collection - 2
In this post we have covered Java’s implementation of GC. This post is continuation of Garbage Collection Post in which we have covered the theory for GC.
There are multiple garbage collection strategies which one can use. From J2SE™ 5.0, the garbage collector is selected based on the class of the machine on which the application is run.
The graph below models an ideal system that is perfectly scalable with the exception of garbage collection. The red line is an application spending only 1% of the time in garbage collection on a uniprocessor system. This translates to more than a 20% loss in throughput on 32 processor systems.
Since collections occur when generations fill up, throughput is inversely proportional to the amount of memory available.
Some jargons:
- Promptness is the time between when an object becomes dead and when the memory becomes available, an important consideration for distributed systems, including remote method invocation (RMI).
- Footprint is the working set of a process, measured in pages and cache lines.
- Throughput is the percentage of total time not spent in garbage collection, considered over long periods of time.
- Pauses are the times when an application appears unresponsive because garbage collection is occurring.
Sun/Oracle HotSpot JVM
The Sun/Oracle HotSpot JVM further divides the young generation into three sub-areas: one large area named “Eden” and two smaller “survivor spaces” named “From” and “To”.
- As a rule, new objects are allocated in “Eden” (with the exception that if a new object is too large to fit into “Eden” space, it will be directly allocated in the old generation).
- During a GC, the live objects in “Eden” first move into the survivor spaces and stay there until they have reached a certain age (in terms of numbers of GCs passed since their creation), and only then they are transferred to the old generation. Thus, the role of the survivor spaces is to keep young objects in the young generation for a little longer than just their first GC, in order to be able to still collect them quickly should they die soon afterwards.
Based on the assumption that most of the young objects may be deleted during a GC, a copying strategy (“copy collection”) is being used for young generation GC.
The following diagram illustrates the difference between committed space and virtual space in the heap. At initialization of the virtual machine, the entire space for the heap is reserved. The size of the space reserved can be specified with the -Xmx option. If the value of the -Xms parameter is smaller than the value of the -Xmx parameter, not all of the space that is reserved is immediately committed to the virtual machine. The uncommitted space is labeled “virtual” in this figure.
PseudoCode (Young Generation GC)
- At the beginning of a GC, the survivor space
Tois empty and objects can only exist inEdenorFrom. - Then, during the GC, all objects in
Edenthat are still being referenced are moved intoTo. - Regarding
From, the still referenced objects in this space are handled depending on their age.- If they have not reached a certain age (tenuring threshold), they are also moved into
To. - Otherwise they are moved into the old generation.
- If they have not reached a certain age (tenuring threshold), they are also moved into
- At the end of this copying procedure,
EdenandFromcan be considered empty (because they only contain dead objects), and all live objects in the young generation are located inTo. - Should
Tofill up at some point during the GC, all remaining objects are moved into the old generation instead (and will never return). - As a final step,
FromandToswap their roles (or, more precisely, their names) so thatTois empty again for the next GC andFromcontains all remaining young objects.
It now becomes clear why young generation sizing is so important: If the young generation is too small, short-lived objects will quickly be moved into the old generation where they are harder to collect. Conversely, if the young generation is too large, we will have lots of unnecessary copying for long-lived objects that will later be moved to the old generation anyway. Unfortunately, finding the right compromise for a particular application can often only be done by systematic measurement and tuning. And that’s where the JVM flags come into play.
JVM Flags
-XX:NewSize and -XX:MaxNewSize:
Similar to the total heap size (with -Xms and -Xmx) it is possible to explicitly set a lower and upper bound for the size of the young generation.
For stability reasons it is not allowed to choose a young generation size larger than the old generation, because in the worst case it may become necessary for a GC to move all objects from the young generation into the old generation. Thus -Xmx/2 is an upper bound for -XX:MaxNewSize.
-XX:NewRatio:
It is also possible to specify the young generation size in relation to the size of the old generation. The potential advantage of this approach is that the young generation will grow and shrink automatically when the JVM dynamically adjusts the total heap size at run time. For example, with -XX:NewRatio=3 the old generation will be three times as large as the young generation.
If we mix absolute and relative sizing of the young generation, the absolute values always have precedence.
-XX:SurvivorRatio:
The flag -XX:SurvivorRatio is similar to -XX:NewRatio but applies to the areas inside the young generation. The value of -XX:SurvivorRatio specifies how large Eden should be sized relative to one of the two survivor spaces. For example, with -XX:SurvivorRatio=10 we dimension Eden ten times as large as To (and at the same time ten times as large as From)
-XX:+PrintTenuringDistribution:
With the flag -XX:+PrintTenuringDistribution we tell the JVM to print the age distribution of all objects contained in the survivor spaces on each young generation GC. Take the following example:
Desired survivor size 75497472 bytes, new threshold 15 (max 15)
- age   1:   19321624 bytes,   19321624 total
- age   2:      79376 bytes,   19401000 total
- age   3:    2904256 bytes,   22305256 total
The first line tells us that the target utilization of the To survivor space is about 75 MB. It also shows some information about the tenuring threshold, which represents the number of GCs that an object may stay in the young generation before it is moved into the old generation (i.e., the maximum age of the object before it gets promoted). In this example, we see that the current tenuring threshold is 15 and that its maximum value is 15 as well.
The next lines show, for each object age lower than the tenuring threshold, the total number of bytes of all objects that currently have that age. In the example, about 19 MB have already survived one GC, about 79 KB have survived two GCs, and about 3 MB have survived three GCs. At the end of each line, we see the accumulated byte count of all objects up to that age. Thus, the “total” value in the last line indicates that the To survivor space currently contains about 22 MB of object data. As the target utilization of To is 75 MB and the current tenuring threshold is 15, we can conclude that no objects have to be promoted to the old generation as part of the current young generation GC.
Now suppose that the next GC leads to the following output:
Desired survivor size 75497472 bytes, new threshold 2 (max 15)
- age   1:   68407384 bytes,   68407384 total
- age   2:   12494576 bytes,   80901960 total
- age   3:      79376 bytes,   80981336 total
- age   4:    2904256 bytes,   83885592 total
Let us compare the output to the previous tenuring distribution. Apparently, all the objects of age 2 and 3 from the previous output are still located in “To”, because here we see exactly the same number of bytes printed for age 3 and 4. We can also conclude that some of the objects in “To” have been successfully collected by the GC, because now we only have 12 MB of objects of age 2 while in the previous output we had 19 MB listed for age 1. Finally, we see that about 68 MB of new objects, shown at age 1, have been moved from “Eden” into “To” during the last GC.
Note that the total number of bytes in “To” – in this case almost 84 MB – is now larger than the desired number of 75 MB. As a consequence, the JVM has reduced the tenuring threshold from 15 to 2, so that with the next GC some of the objects will be forced to leave “To”. These objects will then either be collected (if they have died in the meantime) or moved to the old generation (if they are still referenced).
-XX:InitialTenuringThreshold, -XX:MaxTenuringThreshold and -XX:TargetSurvivorRatio:
The tuning knobs shown in the output of -XX:+PrintTenuringDistribution can be adjusted by various flags. With -XX:InitialTenuringThreshold and -XX:MaxTenuringThreshold we can set the initial and maximum value of the tenuring threshold, respectively. Additionally, we can use -XX:TargetSurvivorRatio to specify the target utilization (in percent) of To at the end of a young generation GC. For example, the combination -XX:MaxTenuringThreshold=10 -XX:TargetSurvivorRatio=90 sets an upper bound of 10 for the tenuring threshold and a target utilization of 90 percent for the To survivor space.
Points to keep in mind:
- If the tenuring distribution shows that many objects just grow older and older before finally reaching the maximum tenuring threshold, this indicates that the value of
-XX:MaxTenuringThresholdmay be too large. - If the value of
-XX:MaxTenuringThresholdis larger than 1 but most objects never reach an age larger than 1, we should take a look at the target utilization ofTo.
-XX:+NeverTenure and -XX:+AlwaysTenure:
If -XX:+NeverTenure is set, objects are never promoted to the old generation. However, as such, the flag is apparently very risky and also wastes at least half of the reserved heap memory. The inverse behavior can be triggered with -XX:+AlwaysTenure, i.e., no survivor spaces are used so that all young objects are immediately promoted to the old generation on their first GC.
Java Collectors
The Java HotSpot VM includes three different collectors, each with different performance characteristics.
1. Serial Collector (Generational)
It uses a single thread to perform all garbage collection work, which makes it relatively efficient since there is no communication overhead between threads. The serial collector is selected by default on certain hardware and operating system configurations, or can be explicitly enabled with the option -XX:+UseSerialGC.
2. Parallel/Throughput Collector Collector
It performs minor collections in parallel, which can significantly reduce garbage collection overhead. It is intended for applications with medium- to large-sized data sets that are run on multi-processor/threaded hardware. The parallel collector is selected by default on certain hardware and operating system configurations, or can be explicitly enabled with the option -XX:+UseParallelGC. Parallel compaction is a feature introduced in J2SE 5.0 update 6 and enhanced in Java SE 6 that allows the parallel collector to perform major collections in parallel. Without parallel compaction, major collections are performed using a single thread, which can significantly limit scalability. Parallel compaction is enabled by adding the option -XX:+UseParallelOldGC to the command line. Note that with Java 7 the situation has changed a bit (see, e.g., this overview) so that -XX:+UseParallelGC may be used to the same effect as -XX:+UseParallelOldGC.
Starting at so-called “GC roots”, the GC then searches the heap for reachable objects and marks them as alive. Afterwards, the GC moves the live objects within the old generation so that they occupy a single, non-fragmented memory block, and takes a note that the remaining memory area is free. That is, we don’t follow a copying strategy into a different heap area, like the young generation GC algorithm does.
On a machine with N processors the parallel collector uses N garbage collector threads; however, this number can be adjusted with a command line option -XX:ParallelGCThreads=<N>. On a host with one processor, the parallel collector will likely not perform as well as the serial collector because of the overhead required for parallel execution (e.g., synchronization).
Because there are multiple garbage collector threads participating in the minor collection there is a small possibility of fragmentation due to promotions from the young generation to the tenured generation during the collection. Each garbage collection thread reserves a part of the tenured generation for promotions and the division of the available space into these “promotion buffers” can cause a fragmentation effect.
The arrangement of the generations is different in the parallel collector. That arrangement is shown in the figure below.
The parallel collector uses a method of automatic tuning that allows desired behaviors to be specified instead of generation sizes and other low-level tuning details. The behaviors that can be specified are (arranged in order of their precedence):
- Maximum garbage collection pause time:
The maximum pause time goal is specified with the command line option
-XX:MaxGCPauseMillis=<N>. This is interpreted as a hint that pause times ofmilliseconds or less are desired; by default there is no maximum pause time goal. If a pause time goal is specified, the heap size and other garbage collection related parameters are adjusted in an attempt to keep garbage collection pauses shorter than the specified value. - Throughput: The goal is specified by the command line option
-XX:GCTimeRatio=<N>, which sets the ratio of garbage collection time to application time to1 / (1 + <N>). For example,-XX:GCTimeRatio=19sets a goal of1/20or5%of the total time in garbage collection. The default value is99, resulting in a goal of1%of the time in garbage collection. - Footprint (i.e., heap size): Maxmimum heap footprint is specified using the existing option
-Xmx<N>. In addition, the collector has an implicit goal of minimizing the size of the heap as long as the other goals are being met.
Growing and shrinking the size of a generation is done by increments that are a fixed percentage of the size of the generation so that a generation steps up or down toward its desired size. Growing and shrinking are done at different rates. By default a generation grows in increments of 20% and shrinks in increments of 5%. The percentage for growing is controlled by the command line flag -XX:YoungGenerationSizeIncrement=<Y> for the young generation and -XX:TenuredGenerationSizeIncrement=<T> for the tenured generation. The percentage by which a generation shrinks is adjusted by the command line flag -XX:AdaptiveSizeDecrementScaleFactor=<D>. If the growth increment is X percent, the decrement for shrinking is X / D percent.
Some Rules:
- If the collector decides to grow a generation at startup, there is a supplemental percentage added to the increment. This supplement decays with the number of collections and there is no long term affect of this supplement. The intent of the supplement is to increase startup performance. There is no supplement to the percentage for shrinking.
- If the maximum pause time goal is not being met, the size of only one generation is shrunk at a time. If the pause times of both generations are above the goal, the size of the generation with the larger pause time is shrunk first.
- If the throughput goal is not being met, the sizes of both generations are increased. Each is increased in proportion to its respective contribution to the total garbage collection time. For example, if the garbage collection time of the young generation is 25% of the total collection time and if a full increment of the young generation would be by 20%, then the young generation would be increased by 5%.
- The parallel collector will throw an OutOfMemoryError if too much time is being spent in garbage collection: if more than 98% of the total time is spent in garbage collection and less than 2% of the heap is recovered, an OutOfMemoryError will be thrown. This feature is designed to prevent applications from running for an extended period of time while making little or no progress because the heap is too small. If necessary, this feature can be disabled by adding the option
-XX:-UseGCOverheadLimitto the command line.
3. Concurrent Collector (Generational)
It performs most of its work concurrently (i.e., while the application is still running) to keep garbage collection pauses short. It is designed for applications with medium- to large-sized data sets for which response time is more important than overall throughput, since the techniques used to minimize pauses can reduce application performance. The concurrent collector is enabled with the option -XX:+UseConcMarkSweepGC.
Minor collections can interleave with an on-going major cycle, and are done in a manner similar to the parallel collector (in particular, the application threads are stopped during minor collections).
The concurrent collector attempts to reduce pause times due to major collections by using separate garbage collector threads to trace the reachable objects concurrently with the execution of the application threads. During each major collection cycle, the concurrent collector will pause all the application threads for a brief period at the beginning of the collection and again toward the middle of the collection. The second pause tends to be the longer of the two pauses and multiple threads are used to do the collection work during that pause. The remainder of the collection including the bulk of the tracing of live objects and sweeping of unreachable objects is done with one or more garbage collector threads that run concurrently with the application.
The basic algorithms used by the concurrent collector are described in the technical report A Generational Mostly-concurrent Garbage Collector.:
- Initial Mark: The application threads are paused in order to collect their object references. When this is finished, the application threads are started again.
- Concurrent Mark: Starting from the object references collected in phase 1, all other referenced objects are traversed.
- Concurrent Preclean: Changes to object references made by the application threads while phase 2 was running are used to update the results from phase 2.
- Remark: As phase 3 is concurrent as well, further changes to object references may have happened. Therefore, the application threads are stopped once more to take any such updates into account and ensure a correct view of referenced objects before the actual cleaning takes place. This step is essential because it must be avoided to collect any objects that are still referenced.
- Concurrent Sweep: All objects that are not referenced anymore get removed from the heap.
- Concurrent Reset: The collector does some housekeeping work so that there is a clean state when the next GC cycle starts.
Flags:
-XX:+UseConcMarkSweepGC: This flag is needed to activate the CMS Collector in the first place. By default, HotSpot uses the Throughput Collector instead.-XX:+UseParNewGC: When the CMS collector is used, this flag activates the parallel execution of young generation GCs using multiple threads. Recent JVM versions-XX:+UseParNewGCis enabled automatically when-XX:+UseConcMarkSweepGCis set. As a consequence, if parallel young generation GC is not desired, it needs to be disabled by setting-XX:-UseParNewGC.-XX:+CMSConcurrentMTEnabled: When this flag is set, the concurrent CMS phases are run with multiple threads (and thus, multiple GC threads work in parallel with all the application threads). This flag is already activated by default.-XX:ConcGCThreads: The flag-XX:ConcGCThreads=<value>(in earlier JVM versions also known as-XX:ParallelCMSThreads) defines the number of threads with which the concurrent CMS phases are run. If this flag is not explicitly set, the JVM computes a default number of parallel CMS threads which depends on the value of the flag-XX: ParallelGCThreads known from the Throughput Collector.The formula used isConcGCThreads = (ParallelGCThreads + 3)/4. Thus, with the CMS Collector, the flag-XX:ParallelGCThreadsdoes not only affect stop-the-world GC phases but also the concurrent phases.
There are many more flags which can be found in references.
Overhead of Concurrency:
The concurrent collector trades processor resources (which would otherwise be available to the application) for shorter major collection pause times. The most visible overhead is the use of one or more processors during the concurrent parts of the collection. On an N processor system, the concurrent part of the collection will use K/N of the available processors, where 1 <= K <= ceiling{N/4}. (Note that the precise choice of and bounds on K are subject to change.) In addition to the use of processors during concurrent phases, additional overhead is incurred to enable concurrency. Thus while garbage collection pauses are typically much shorter with the concurrent collector, application throughput also tends to be slightly lower than with the other collectors.
Concurrent Mode Failure:
If the concurrent collector is unable to finish reclaiming the unreachable objects before the tenured generation fills up, or if an allocation cannot be satisfied with the available free space blocks in the tenured generation, then the application is paused and the collection is completed with all the application threads stopped. The inability to complete a collection concurrently is referred to as concurrent mode failure and indicates the need to adjust the concurrent collector parameters.
Excessive GC Time and OutOfMemoryError:
The policy is the same as that in the parallel collector, except that time spent performing concurrent collections is not counted toward the 98% time limit. In other words, only collections performed while the application is stopped count toward excessive GC time. Such collections are typically due to a concurrent mode failure or an explicit collection request (e.g., a call to System.gc()).
Floating Garbage:
Because application threads and the garbage collector thread run concurrently during a major collection, objects that are traced by the garbage collector thread may subsequently become unreachable by the time collection finishes. Such unreachable objects that have not yet been reclaimed are referred to as floating garbage. The amount of floating garbage depends on the duration of the concurrent collection cycle and on the frequency of reference updates, also known as mutations, by the application.
Pauses:
The concurrent collector pauses an application twice during a concurrent collection cycle. The first pause is to mark as live the objects directly reachable from the roots (e.g., object references from application thread stacks and registers, static objects and so on) and from elsewhere in the heap (e.g., the young generation). This first pause is referred to as the initial mark pause. The second pause comes at the end of the concurrent tracing phase and finds objects that were missed by the concurrent tracing due to updates by the application threads of references in an object after the concurrent collector had finished tracing that object. This second pause is referred to as the remark pause.
Concurrent Phases:
The concurrent tracing of the reachable object graph occurs between the initial mark pause and the remark pause. After the remark pause, there is a concurrent sweeping phase which collects the objects identified as unreachable.
Starting a Concurrent Collection Cycle:
With the serial collector a major collection occurs whenever the tenured generation becomes full and all application threads are stopped while the collection is done. In contrast, a concurrent collection needs to be started at a time such that the collection can finish before the tenured generation becomes full; otherwise the application would observe longer pauses due to concurrent mode failure. There are several ways a concurrent collection can be started.
Based on recent history, the concurrent collector maintains estimates of the time remaining before the tenured generation will be exhausted and of the time needed for a concurrent collection cycle. Based on these dynamic estimates, a concurrent collection cycle will be started with the aim of completing the collection cycle before the tenured generation is exhausted. These estimates are padded for safety, since the concurrent mode failure can be very costly.
A concurrent collection will also start if the occupancy of the tenured generation exceeds an initiating occupancy, a percentage of the tenured generation. The default value of this initiating occupancy threshold is approximately 92%, but the value is subject to change from release to release. This value can be manually adjusted using the command line option -XX:CMSInitiatingOccupancyFraction=<N>, where
Scheduling Pauses:
The pauses for the young generation collection and the tenured generation collection occur independently. They do not overlap, but may occur in quick succession such that the pause from one collection, immediately followed by one from the other collection, can appear to be a single, longer pause. To avoid this, the concurrent collector attempts to schedule the remark pause roughly midway between the previous and next young generation pauses. This scheduling is currently not done for the initial mark pause, which is usually much shorter than the remark pause.
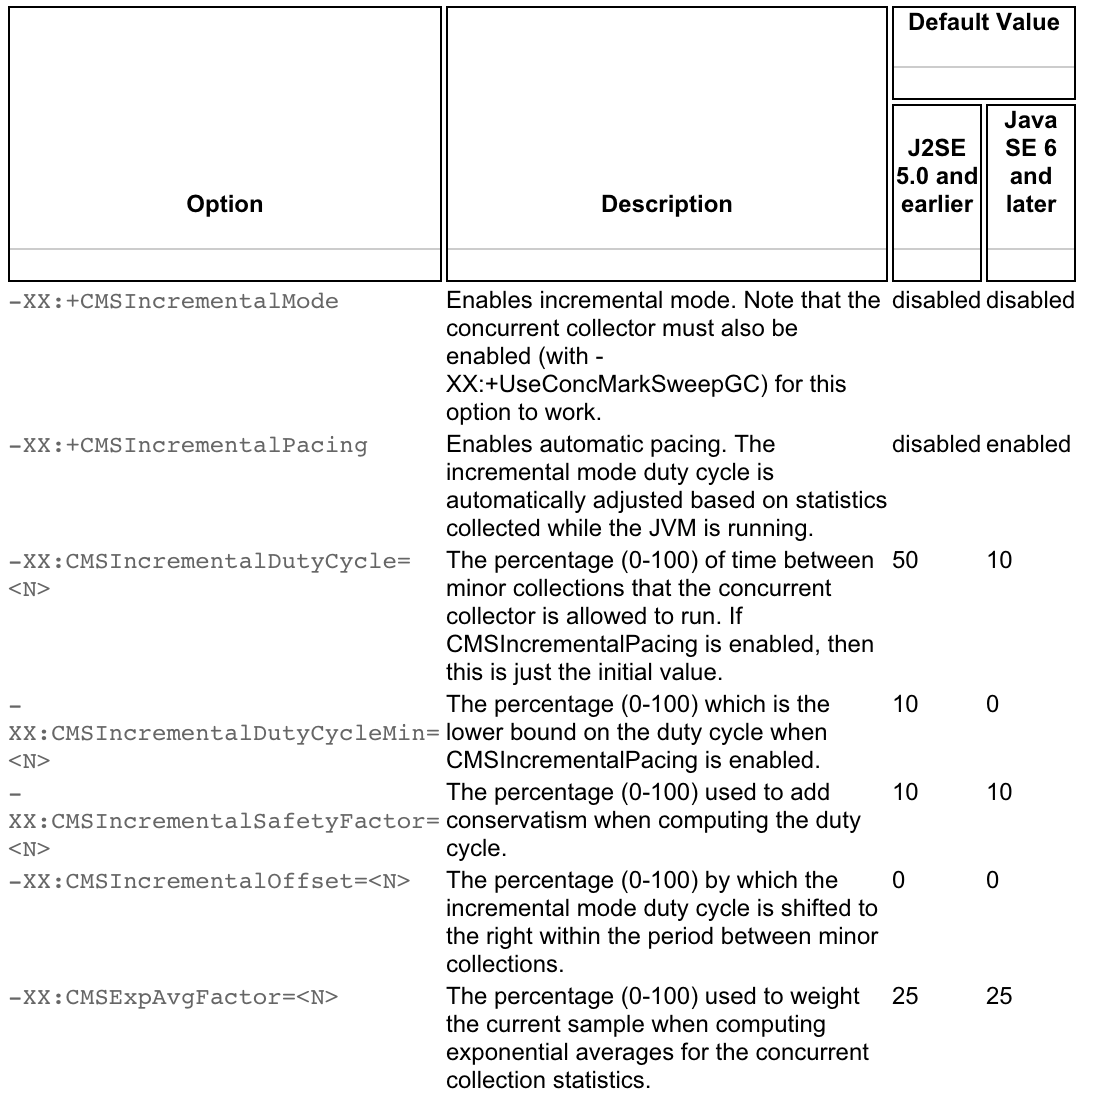
Incremental Mode:
The concurrent collector can be used in a mode in which the concurrent phases are done incrementally. Recall that during a concurrent phase the garbage collector thread is using one or more processors. The incremental mode is meant to lessen the impact of long concurrent phases by periodically stopping the concurrent phase to yield back the processor to the application. This mode, referred to here as i-cms, divides the work done concurrently by the collector into small chunks of time which are scheduled between young generation collections. This feature is useful when applications that need the low pause times provided by the concurrent collector are run on machines with small numbers of processors (e.g., 1 or 2).
i-cms uses a duty cycle to control the amount of work the concurrent collector is allowed to do before voluntarily giving up the processor. The duty cycle is the percentage of time between young generation collections that the concurrent collector is allowed to run. i-cms can automatically compute the duty cycle based on the behavior of the application (the recommended method, known as automatic pacing), or the duty cycle can be set to a fixed value on the command line.
It should be noted that, even though the CMS Collector offers a mostly concurrent solution for old generation GCs, young generation GCs are still handled using a stop-the-world approach. The rationale behind this is that young generation GCs are typically short enough so that the resulting pause times are satisfactory even for interactive applications.
Permanent Generation Size
The permanent generation does not have a noticeable impact on garbage collector performance for most applications. However, some applications dynamically generate and load many classes; for example, some implementations of JavaServer Pages (JSP) pages. These applications may need a larger permanent generation to hold the additional classes. If so, the maximum permanent generation size can be increased with the command-line option -XX:MaxPermSize=<N>.
Explicit Garbage Collection
Another way applications can interact with garbage collection is by invoking full garbage collections explicitly by calling System.gc(). This can force a major collection to be done when it may not be necessary (i.e., when a minor collection would suffice), and so in general should be avoided. The performance impact of explicit garbage collections can be measured by disabling them using the flag -XX:+DisableExplicitGC, which causes the VM to ignore calls to System.gc().
One of the most commonly encountered uses of explicit garbage collection occurs with RMI’s distributed garbage collection (DGC).
To read:
http://www.javacodegeeks.com/2015/07/jvm-buzzwords-java-developers-should-understand.html